Posted by
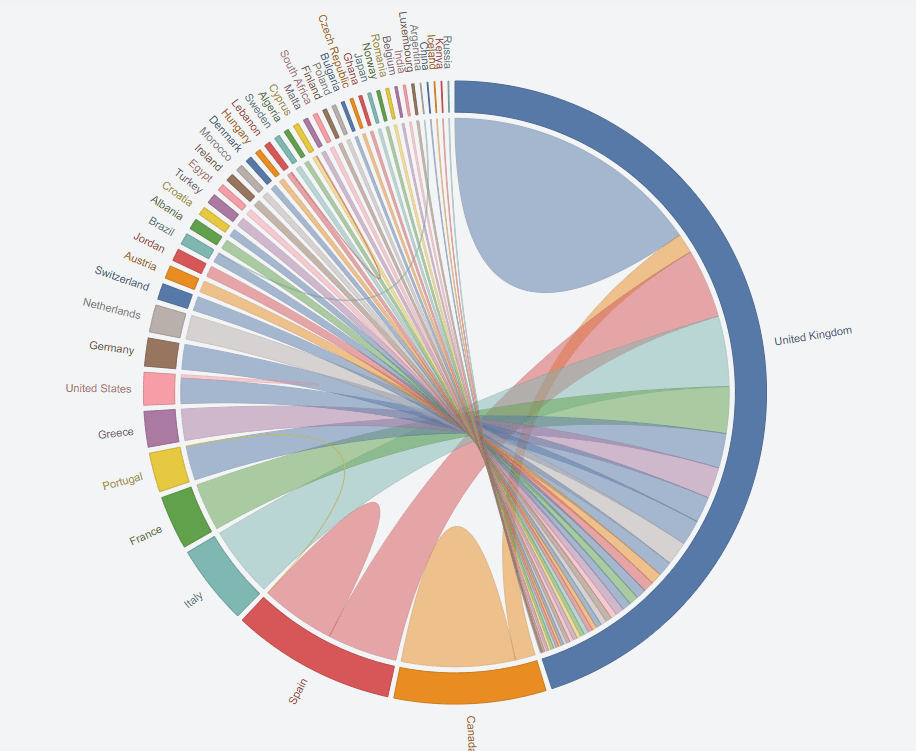
See a data visualization of the East India Company's trade
This tool visualizes the East India Company’s trade from 1760 to 1834, letting you track shipments of tea, textiles, metals, and more. Users can sort by commodity, origin, destination, and date to see London’s vast imperial supply network that shaped the British Empire.
Similar Posts
Here’s what we found related to above. Click through to dive even deeper.













You've reached the end.